Page 17 of 22
Re: The Math Thread
Posted: 18 May 2013 08:41
by Vortex
φ+1 = φ^2
φ-1 = 1/φ
Re: The Math Thread
Posted: 18 May 2013 13:12
by Vurn
Wait what.
Re: The Math Thread
Posted: 18 May 2013 13:39
by Vortex
You can check it with a calculator

Re: The Math Thread
Posted: 18 May 2013 15:01
by The Kakama
I know, it works.
On a calculator, φ=(5/4)^(1/2) +1/2
Re: The Math Thread
Posted: 04 Dec 2015 13:44
by Vortex
Ok, to restart the thread, here's something cool:
As you guys perhaps know, the complex numbers (real+imaginary) form a plane. If we warp the plane adding an extra point, infinity, to close it, we get a sphere, called the
Riemann sphere (infinity IS an number there!

)
Now, the five Platonic solids (tetrahedron, cube, dodecahedron, etc.) can be embedded inside a sphere, with their vertices touching the surface. So I thought, are there any equations whose solutions are exactly the complex number coordinates of the vertices in the Riemann sphere?
I spent some time looking for them, and finally I found that the answer is: yes! There are three different ones, here they are with their plots:
-Tetrahedron:

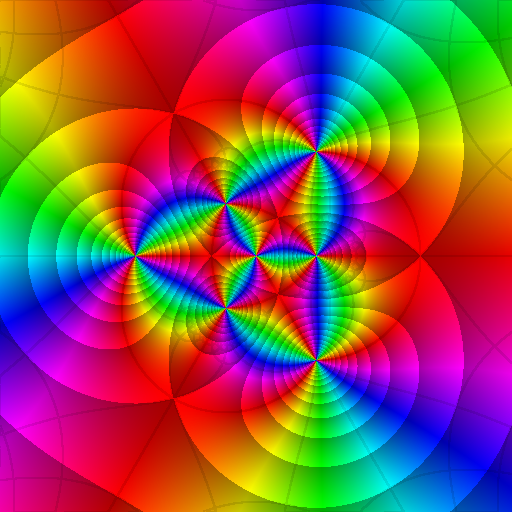
- Tetrahedron.png (258.75 KiB) Viewed 4865 times
-Octahedron:

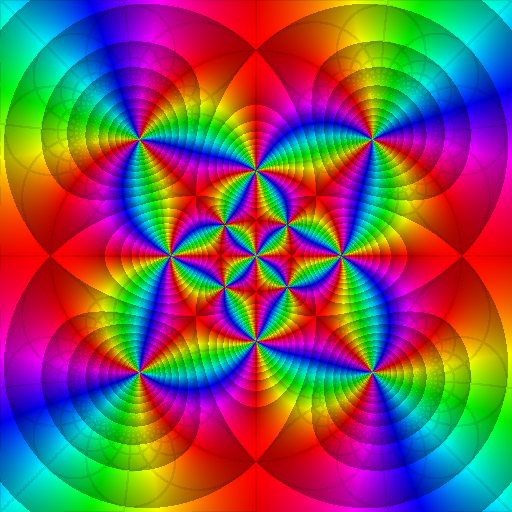
- Octahedron.png (347.16 KiB) Viewed 4865 times
-Icosahedron:

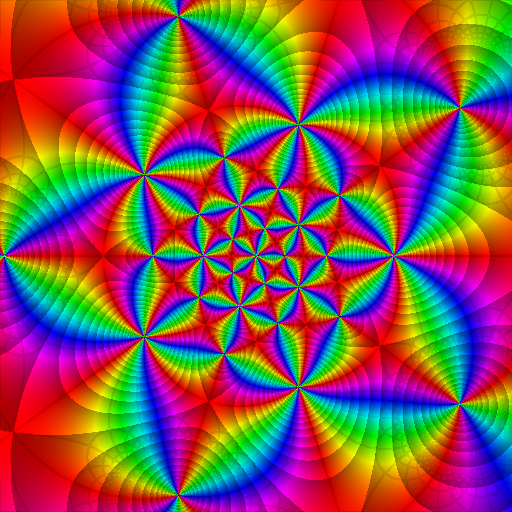
- Icosahedron.png (430.71 KiB) Viewed 4865 times
To obtain the cube and dodecahedron ones, you just flip the fractions' numerator and denominator in the last two equations. Cool or what?

EDIT: if anyone is interested, I used the plugin "conformal" in the Gimp to make the graphs. You can try them yourself, or any other function you like

Re: The Math Thread
Posted: 05 Dec 2015 15:45
by The Kakama
Wow. What's with the colours and lines though?
e^(pi(i))+1 =0
Re: The Math Thread
Posted: 05 Dec 2015 15:58
by Vortex
The colours represent the phase (the "sign") of the complex number. For example, positive numbers are red, negative numbers are light blue, pure imaginary numbers are green and violet, etc. Two shadowed lines next to each other means that the modulus ("size") of the numbers in one of them is double the modulus in the other. It's better explained here:
https://en.wikipedia.org/wiki/Domain_co ... ex_numbers
About the non-shadowed grey lines, I think they're just a square grid, to see how the complex plane deforms when you apply the function.
We have to do that weird color trick to properly draw complex functions, because we need a plane to graph real functions (1D+1D=2D), so to graph complex functions without color we would need 2D+2D=4 dimensions.
e^(pi(i))+1 =0
Good choice of equation
it also has a very cool geometric interpretation.
Re: The Math Thread
Posted: 05 Dec 2015 19:38
by ENIHCAMBUS
I was thinking, if you use a component in an equation that leads up to infinite, and then graph it, you end up having a fractal?
Is this right?
Re: The Math Thread
Posted: 05 Dec 2015 19:57
by Vortex
It's not really about equations, but more about transformations.
Fractals have the property of self-similarity, which means that if you apply a certain transformation to a fractal it stays the same. Things who are unchanged by a certain transformation are said to be a fixed point of that transformation. Written it looks like this:
Transf(Fixpoint) = Fixpoint
Now, if you start with any object, and apply the transformation a lot of times, if you have luck, when you apply it again it won't make much of a difference:
Transf(Transf(Transf(Transf(Transf(Transf(Transf(Transf(Transf(Transf(Object)))))))))) = Transf^10(Object)
won't look very different from
Transf(Transf(Transf(Transf(Transf(Transf(Transf(Transf(Transf(Transf(Object))))))))))=Transf^11(Object)
In the limit, when the number of transformations you apply is infinity, since ∞ = ∞+1 when you apply it one more time it makes
Transf(Transf^∞(Object)) = Transf^(∞+1)(Object) = Transf^∞(Object)
So Transf^∞(Object) is a fixpoint, because the transformation hasn't changed it! So in a sense, the component that is infinite when you are working with fractals is the number of transformations you have applied. Not every fixed point is a fractal, but all fractals are fixed points.
For example, if the transformation is the sprout of two small triangles at each angle of a curve, Transf^∞(Triangle) = Koch Snowflake.
-------------------------------------------------------------------------------------------------------------------------------------
When a function/equation returns infinity, what you have is (usually) a pole. Poles and infinities are not much mysterious, everything becomes much clearer when you study the Riemann sphere. There you see that a pole is something like a reverse zero/root of a function. If you graph functions with pole singularities of degree N, they look exactly like zeros of degree N, with the color wheel inverted.
Re: The Math Thread
Posted: 05 Dec 2015 20:00
by ENIHCAMBUS
Interesting, I just wanted to know if there was a correlation between the 2 types of diagrams.